
Intro to Process Automation (Part 6) - Continuous Improvement with Optimize
From Data to Better Models


The BPM lifecycle doesn’t stop at execution or monitoring. Once a process runs smoothly, the next step is to make it better. Operate shows what’s happening right now, but real improvement means looking at patterns over time. That’s where Optimize helps.
Camunda Optimize gathers past process data, groups it, and shows clear insights. It helps teams see how well processes actually work and where they can be improved to save time, cut costs, or stay compliant.
From Monitoring to Improvement
While Operate focuses on the health of single process instances, Optimize looks at many of them together to spot patterns. It helps answer questions like how long the average process takes, where delays happen most often, and which paths are used the most. These insights go beyond fixing issues and support ongoing process improvement.
In a vacation request example, Optimize can show if manager approvals take longer than expected, if HR updates are often delayed, or if rejection rates are higher in certain departments. With that data, teams can make informed decisions like adjusting approval chains, automating more steps, or shifting resources where they’re needed most.
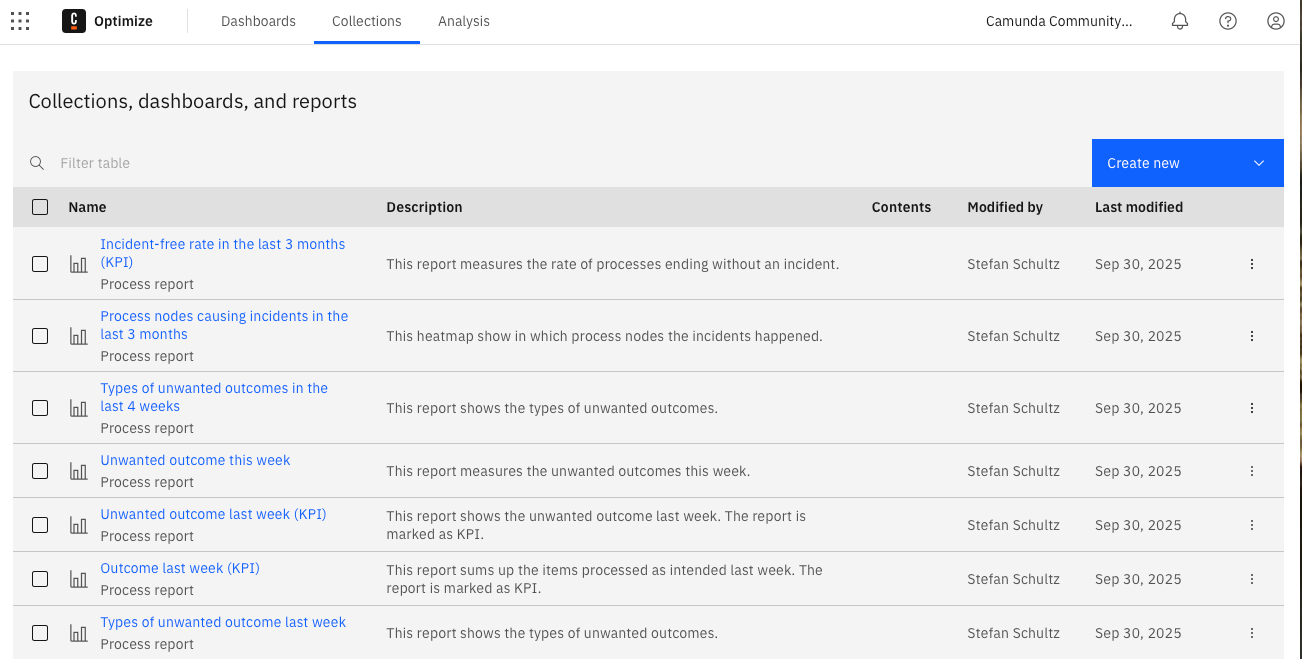
KPIs and Dashboards
A key feature of Optimize is the ability to define key performance indicators for processes. KPIs such as average completion time, cycle time per activity, or incident frequency can be tracked across many process instances. These KPIs aren’t entered manually but come directly from workflow data recorded by Zeebe. Every step in a process instance is logged as an event in the distributed log. Optimize reads this event stream through exporters and stores it in its own data store for analysis.
This means KPIs are always based on real execution data. The duration of a process is measured from the timestamp of the start event to the timestamp of the end event. The time spent in a user task is taken from when the task was created to when it was completed. The number of incidents comes from error events logged during execution. By combining these raw data points, Optimize can calculate aggregated KPIs across thousands of instances with precision.
Alongside these technical metrics, Optimize also supports analysis based on custom process variables. Any variable in a process instance can be used in reports and dashboards. For example, in the vacation request process, the approval result variable can show how many requests were rejected. Another variable, such as approval time, can measure how long supervisors take to complete approvals — showing how long the process stays in that activity. These values are captured during execution and aggregated across all instances, providing insights that go far beyond basic technical monitoring.
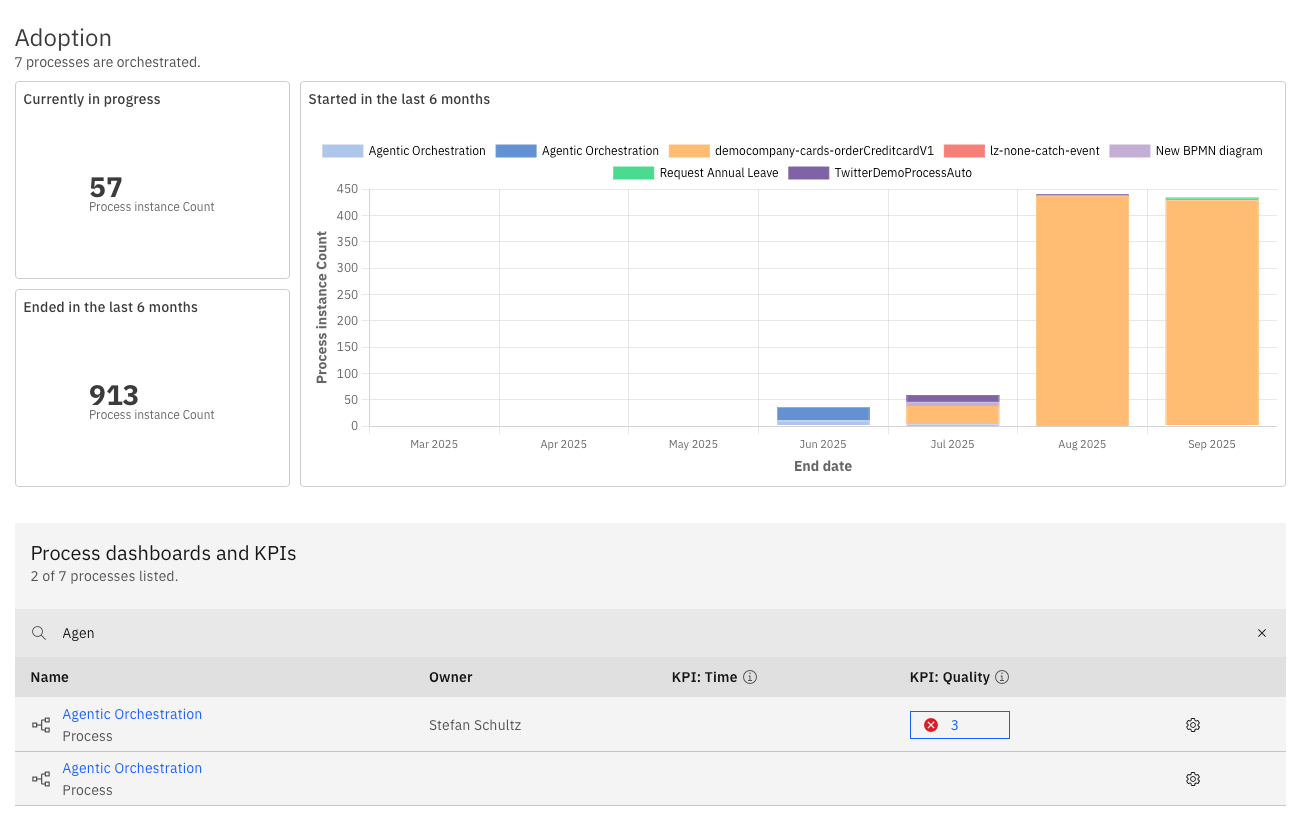
Dashboards bring these insights together in charts and tables that update automatically as new data comes in. For management, this means having direct visibility into whether automation is meeting its goals. For operations teams, it shows where inefficiencies or bottlenecks are tied to specific business conditions.
In practice, a dashboard for the vacation request process might combine technical KPIs like average cycle time with business KPIs like the percentage of rejected requests or the average approval time per supervisor. This gives a complete view of both operational efficiency and business outcomes.
Who Uses Optimize?
Optimize is used by different stakeholders depending on their goals. Business analysts use it to understand how processes behave in reality and where redesigns are needed. Operations teams use it to spot bottlenecks and measure the impact of changes. Management uses it to track strategic KPIs and support decisions about further automation.
The value of Optimize is that it connects all these perspectives. It gives everyone a shared view of how processes perform and makes sure improvement discussions are based on real data, not assumptions.
Closing the Series
This final part completes the journey through the BPM lifecycle with Camunda. We started with the need for automation, explored how models become executable and are deployed, looked at Camunda’s architecture, compared connectors and workers, and saw how processes are monitored in Operate. Optimize closes the loop by providing the tools to keep improving processes over time.
The combination of BPMN for modeling and Camunda 8 for execution, monitoring, and optimization creates a complete setup for process automation. It ensures that processes are not just documented and automated but also transparent and adaptable. This ongoing cycle of modeling, execution, monitoring, and improvement is what makes automation sustainable and effective.
With this series, you now have an overview of how to move from BPMN diagrams to a modern process automation platform. The next step is to apply these ideas to your own processes, start small, monitor results, and keep improving continuously.